CFD gives BrianzAcque a clear benchmark for digester mixing systems
AM-Team used advanced CFD modelling to compare three digester mixing systems for BrianzAcque’s Monza San Rocco wastewater treatment plant, identifying the best-performing solution to minimise sludge accumulation and improve mixing efficiency.
Case highlights:
- BrianzAcque had to choose one of three mixing systems for the extraordinary maintenance of digester 1 at the Monza San Rocco WWTP in Italy.
- AM-Team built a 3D CFD model of the digester with the measured sludge rheology, the biogas phase and a long term solids model.
- Velocity results alone did not separate the systems; the solids model showed that Option 1 kept the bottom solids lowest and most uniform.
- Structural investigation later led BrianzAcque to build a new digester, a decision taken with a quantified view of mixing performance.
Authors
Introduction and problem statement
BrianzAcque S.r.l. is the public operator of the integrated water service in the Province of Monza e Brianza (Lombardy, Italy). It manages the aqueduct and sewerage of the province and two wastewater treatment plants (WWTPs) that together serve 33 municipalities and around 600,000 population equivalents (PE). BrianzAcque recovers energy from biogas and invests continuously in the modernisation of its assets.
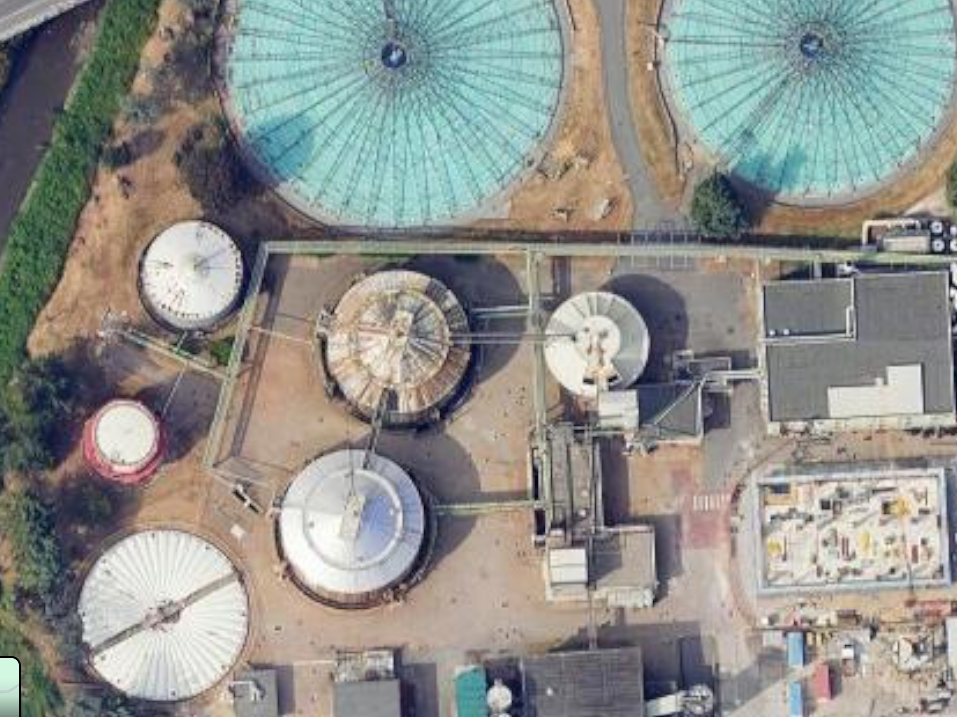
At the Monza San Rocco WWTP, anaerobic digestion stabilises the sludge and produces biogas. In 2023 BrianzAcque planned the extraordinary maintenance of digester 1 (Figure 1). Its mixing system, installed in the 1980s, is based on gas lances combined with units that recirculate sludge and biogas.
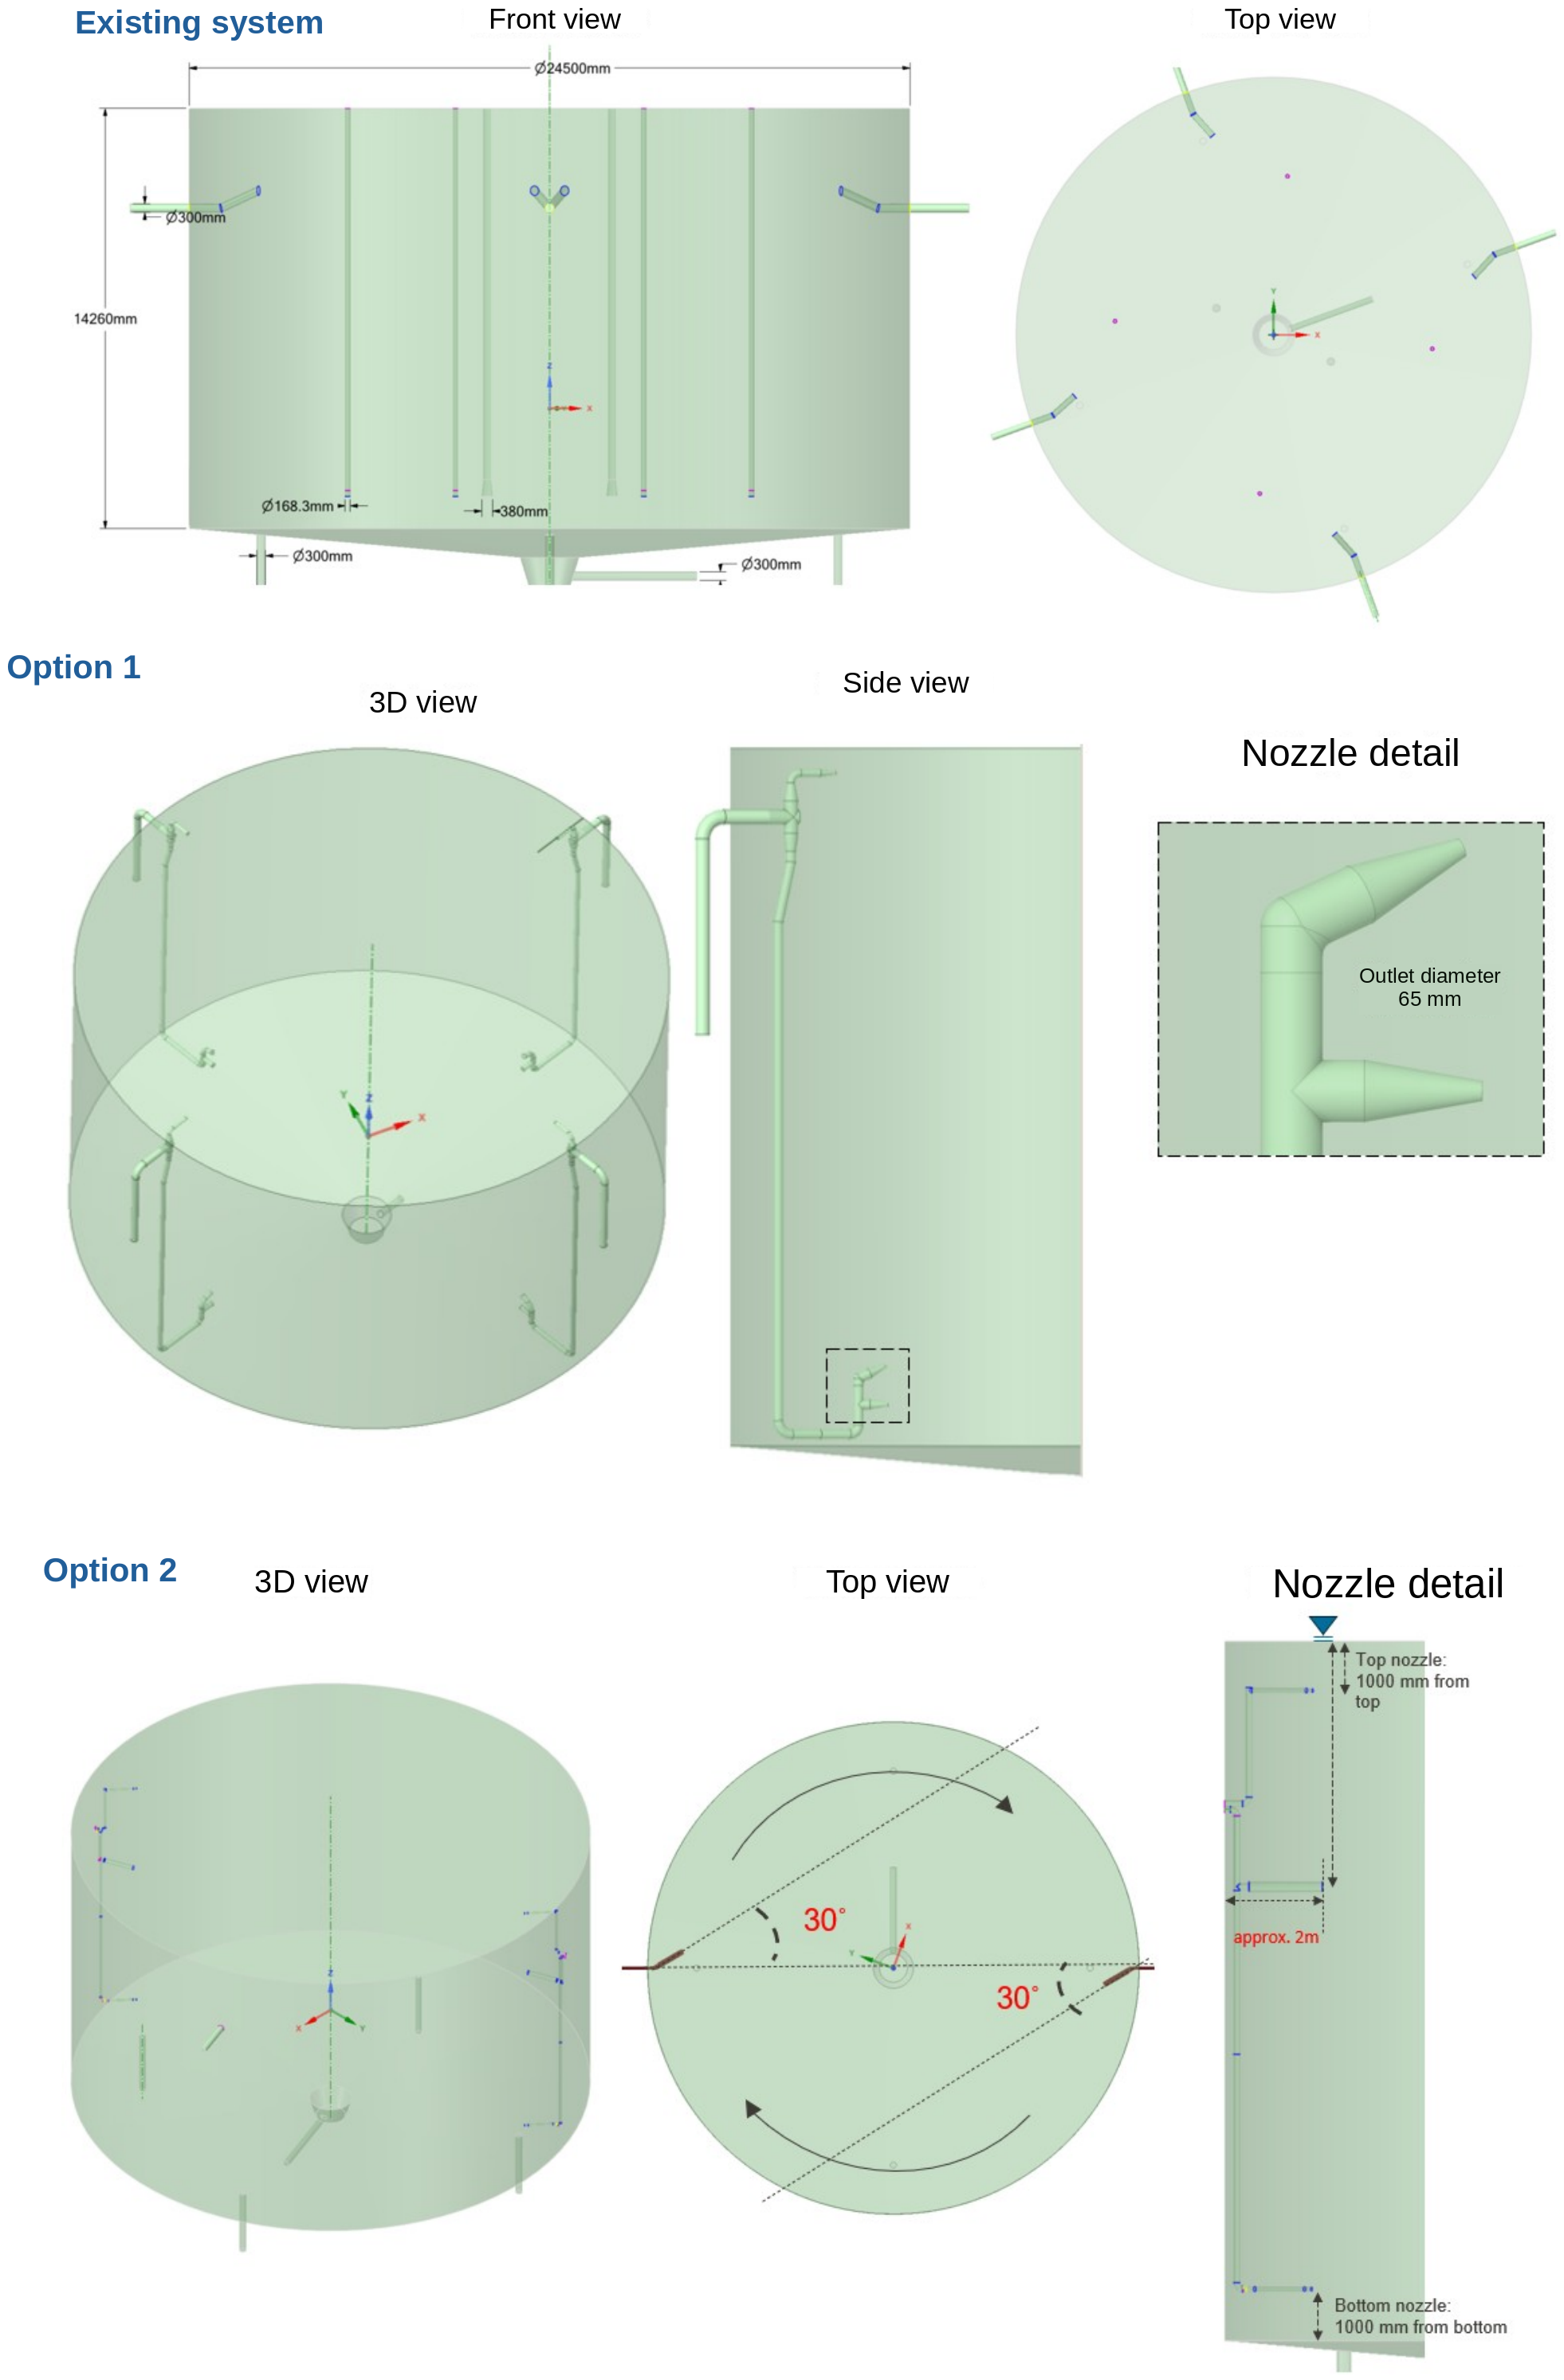
As part of this maintenance project, BrianzAcque wanted to select the best performing mixing technology among three candidates. These were the existing gas lance system, Option 1 (sludge only mixing through nozzles) and Option 2 (sludge or sludge and biogas mixing through nozzles, operated in timed sequences). Poor mixing leads to solids stratification, a sludge bed at the bottom, loss of active volume and lower biogas production, and a mixing system is difficult to change once installed. BrianzAcque therefore wanted to compare the three systems on a common, quantified basis before committing to an investment. Computational fluid dynamics (CFD) allows exactly that: each system can be tested virtually inside the real digester geometry.
Key system characteristics
Digester 1 at the Monza San Rocco WWTP is a cylindrical tank with a conical bottom, 24.5 m in diameter and 14.3 m high. It treats thickened sludge at about 6% dry solids, which behaves as a non-Newtonian fluid: its viscosity drops as the shear rate increases. The existing mixing system, from the 1980s, combines six gas lances with sludge and biogas recirculation units, operated in 12 timed steps. Both alternatives mix the sludge through nozzles near the top and the bottom of the tank; Option 2 can also inject biogas.
“With CFD we could compare three very different mixing systems inside our own digester, under the same conditions. Seeing the long term behaviour of the solids, beyond the velocities, showed us which mixing principles really keep the sludge homogeneous." - Sara Lorenzini, Eng., Strategic Investments vTechnical Officer, BrianzAcque
Solution and objectives
BrianzAcque asked AM-Team to model the digester with its dedicated anaerobic digester CFD model. The model describes the thickened sludge with its real rheology and accounts for the biogas phase, so that the three systems could be compared as they would perform in the San Rocco digester. The objectives were to:
- quantify, for each system and operating step, the share of the digester volume that is well mixed, defined as a sludge velocity above 0.1 m/s;
- locate the dead zones, where the sludge hardly moves;
- predict the long-term solids distribution, using the dry solids concentration at the bottom of the digester as the criterion;
- rank the three systems on these criteria to support BrianzAcque's choice of technology.
Approach
AM-Team builtthe 3D geometry of the digester with all internals of each system (Figure 2).These were the gas lances and recirculation units of the existing system, the top and bottom nozzles of Option 1 with their orientation, and the nozzles ofOption 2 with their three sequences. Each configuration was simulated in steady state, as a single phase (sludge) or two phase (sludge and biogas) flow, with abiogas bubble size of 30 mm.
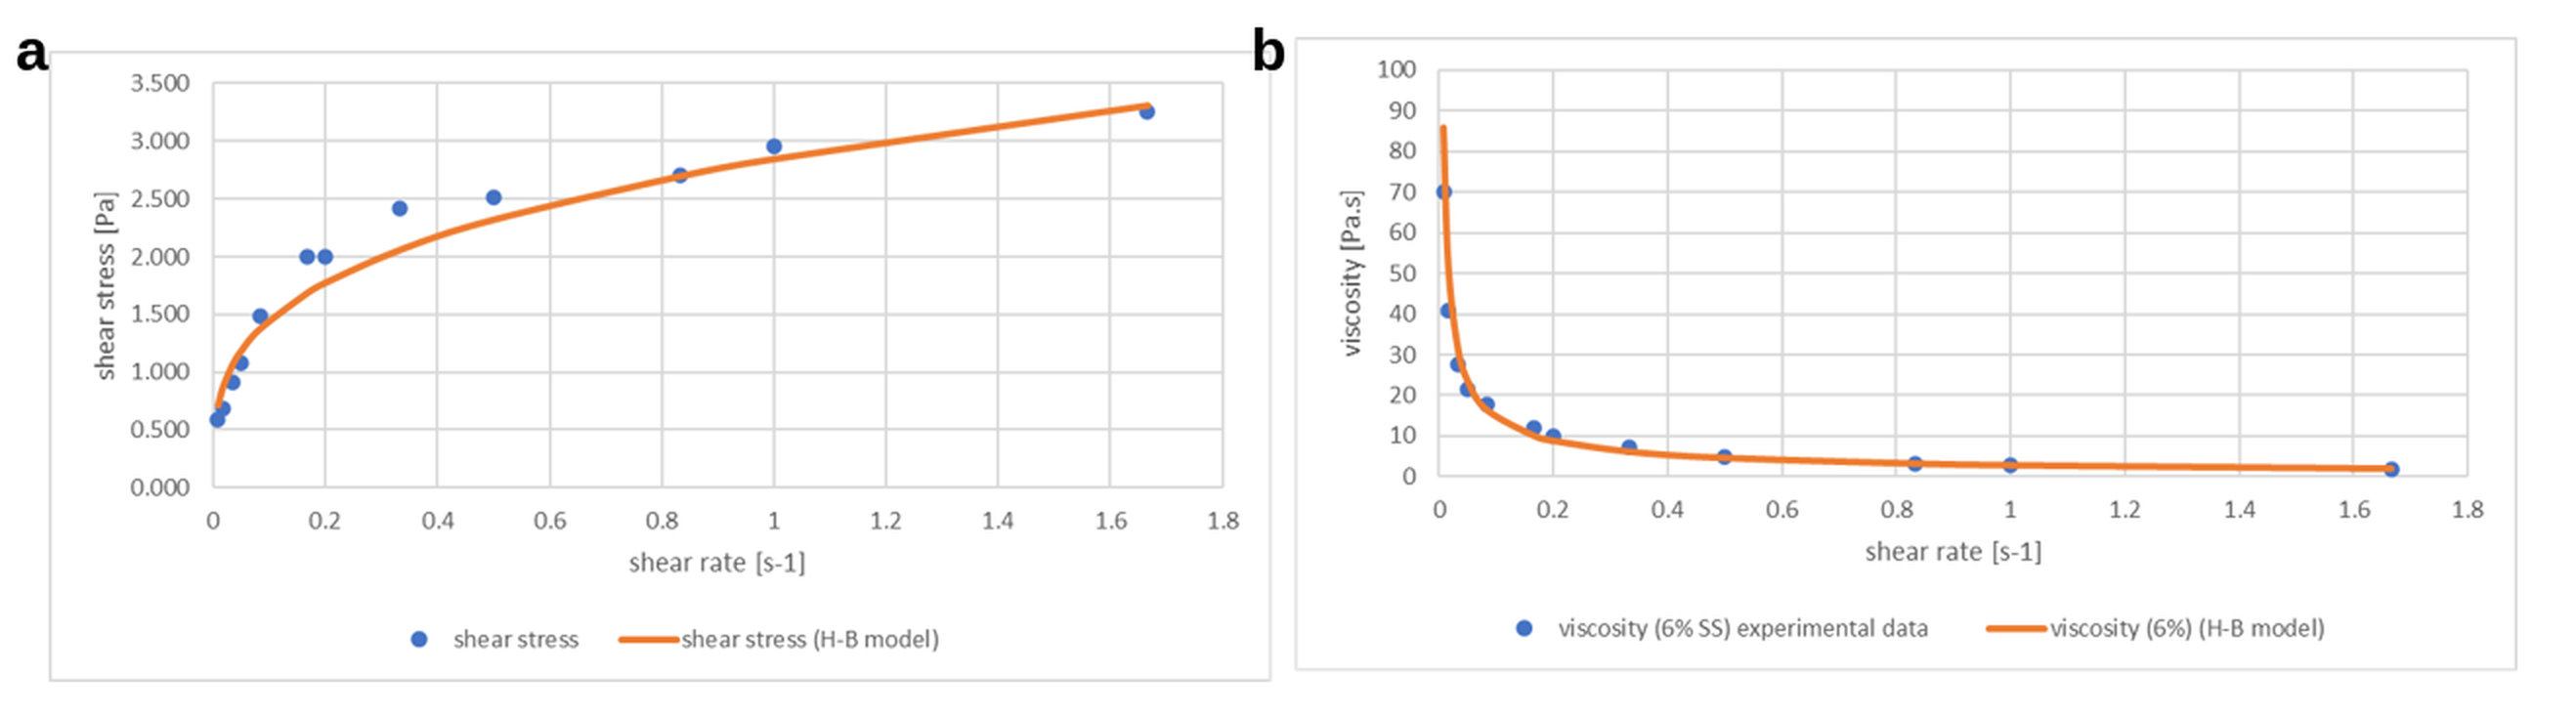
The thickened sludge was described with a Herschel-Bulkley model, calibrated on rheological tests that BrianzAcque had carried out on the San Rocco sludge at 6% dry solids (Figure 3). Velocities and well mixed volumes were then compared step by step. Because no standard method exists for solids settling in digesters, AM-Team developed a solids sedimentation and compression model during the project to predict where solids accumulate over the long term.
Results and findings
Mixing velocities and well mixed volumes
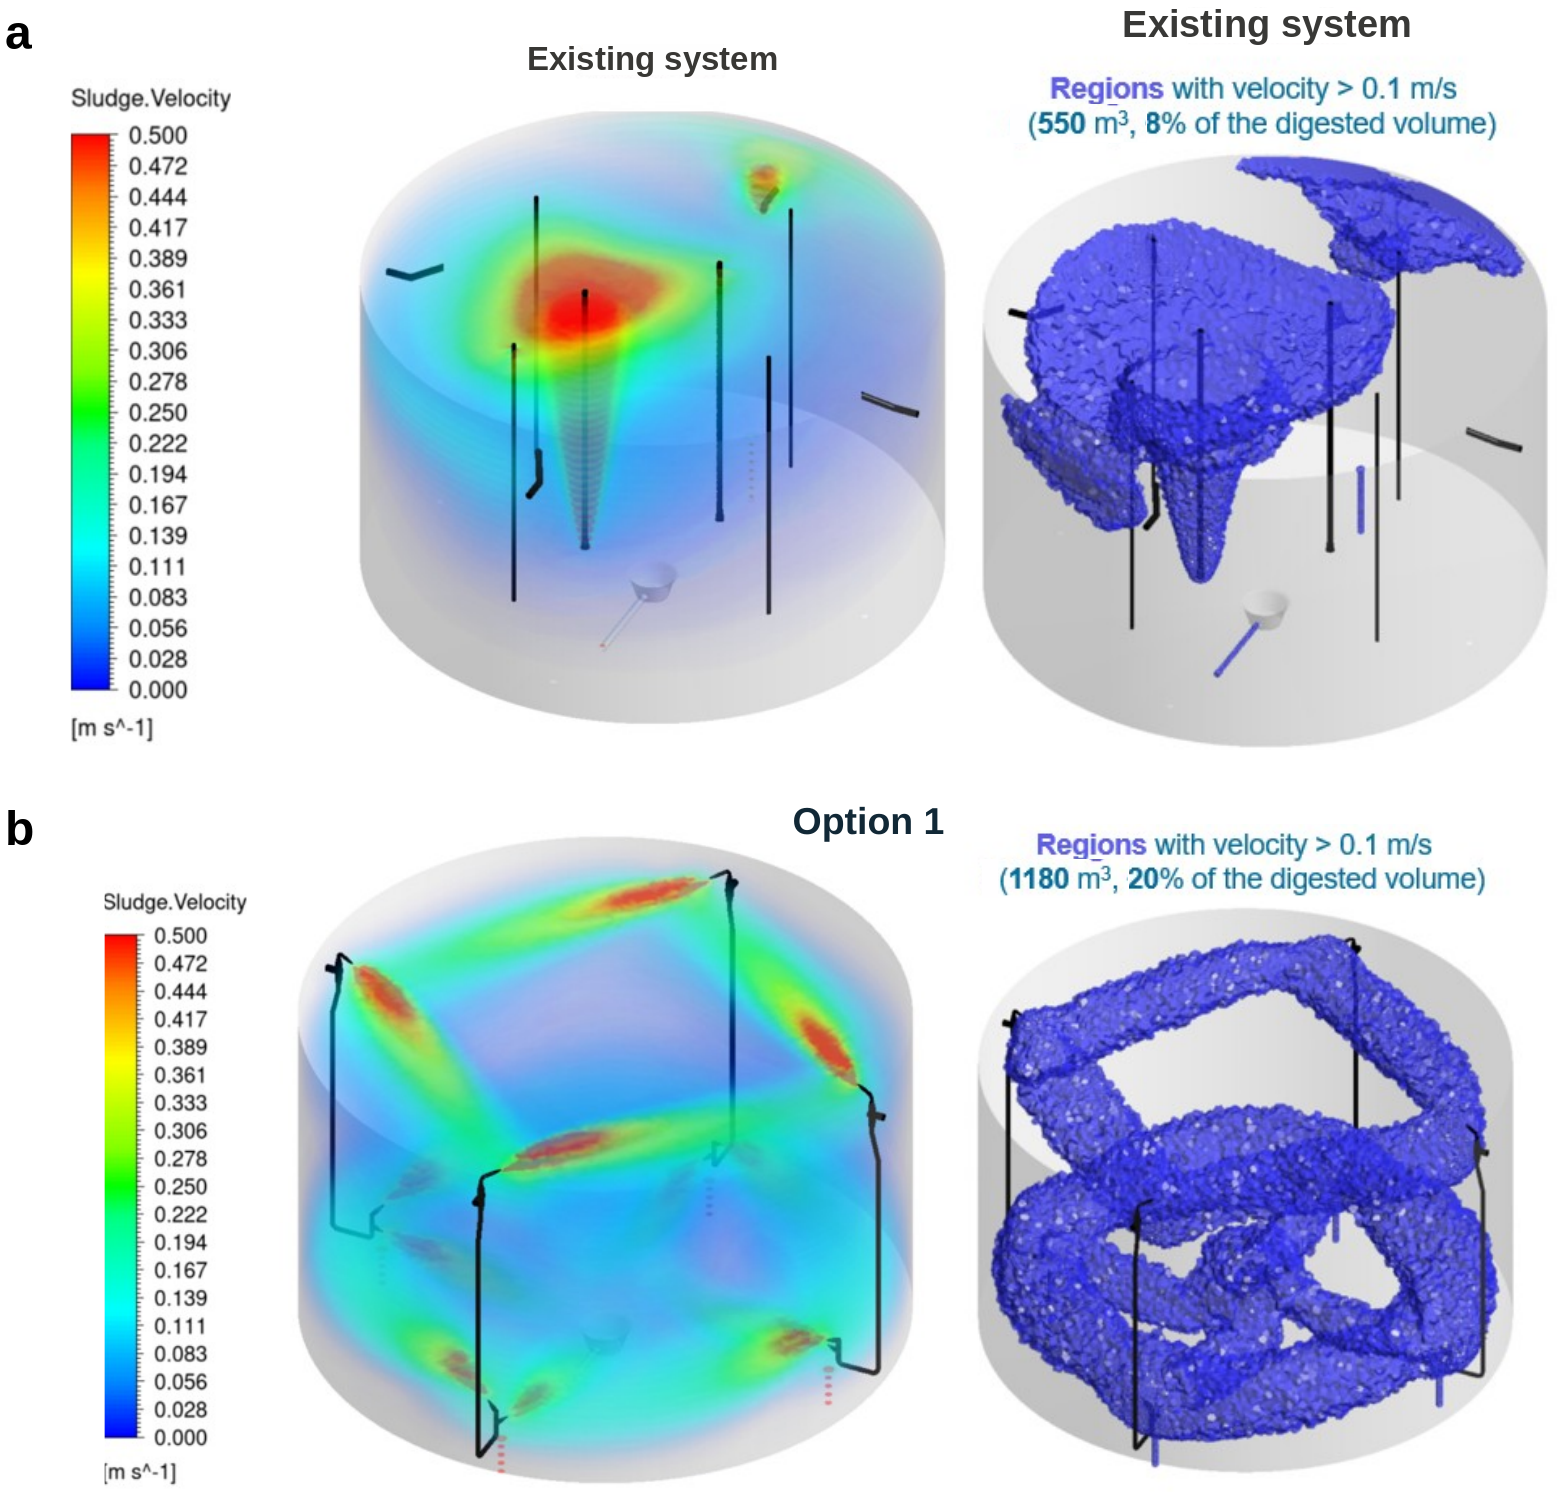
In the existingsystem, the recirculation units mixed only the upper layer and broke thesurface crust, with no visible effect on the layers below (Figure 4a). The gas lance did most of the mixing, but only locally, leaving a large dead zone on the opposite side. About 8% of the volume (550 m3) was well mixed per operating step, and because the recirculation units point upward, much of the biogas left the sludge quickly.
“Our industry is often surprised by what we can do with CFD for anaerobic digesters. We accounted for the non-Newtonian sludge, the biogas and the long-term settling of solids. That is what allowed a fair comparison of three very different technologies.“ - Roberta Muoio, Eng., Customer Success Manager, AM-Team
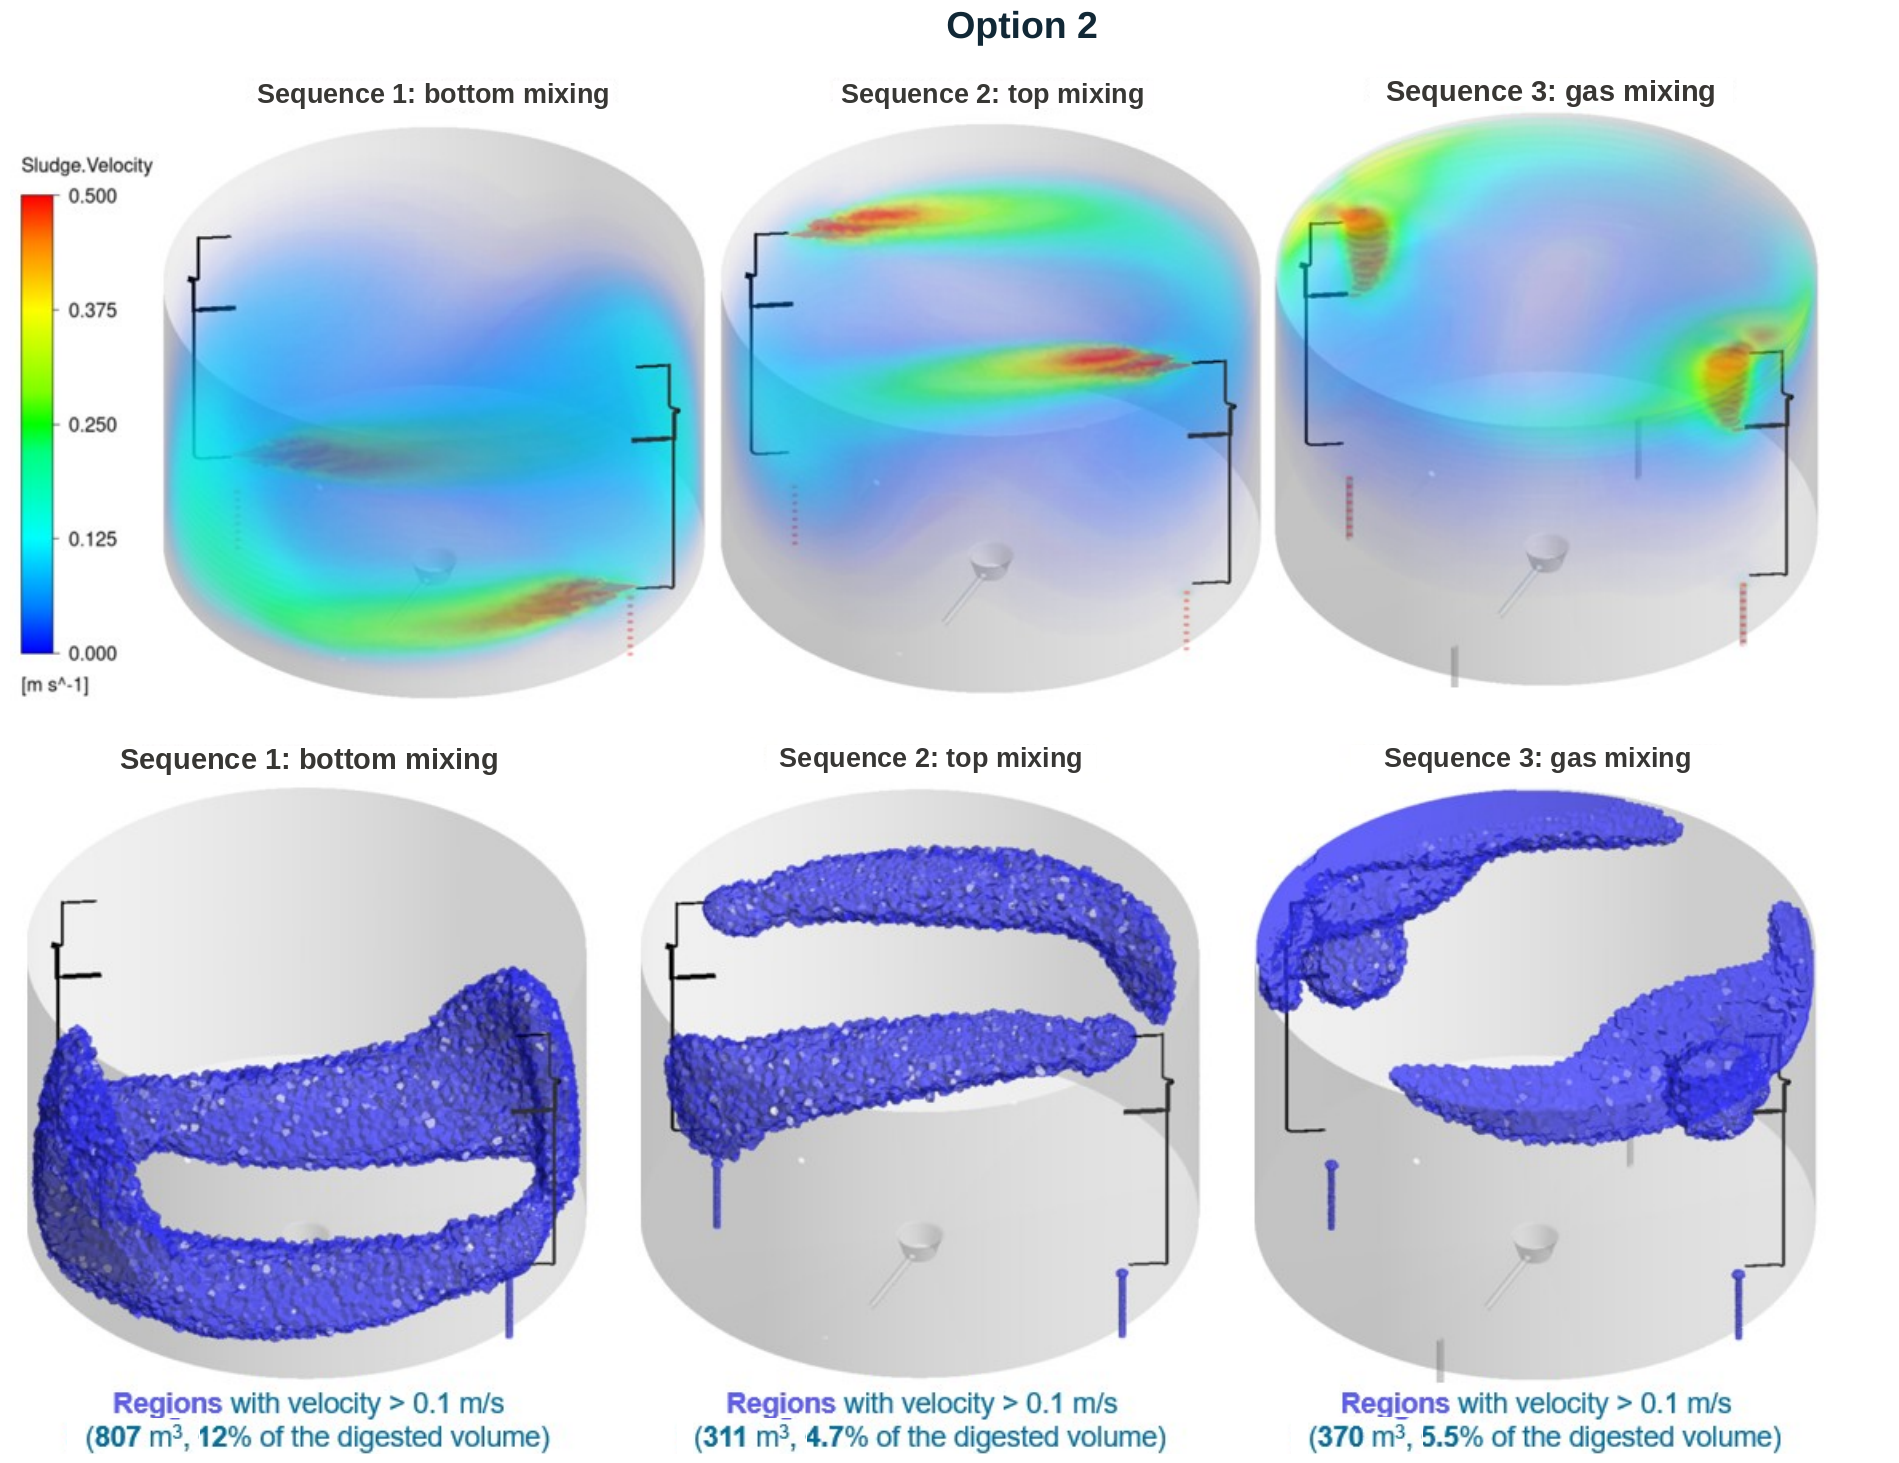
The continuously operating top and bottom nozzles of Option 1 produced higher and more symmetric velocities, with a slower central region (Figure 4b). About 20% of the volume (1,180 m3) was well mixed. In Option 2, the bottom nozzle sequence reached the highest velocities, with 12% of the volume well mixed, while the top and gas mixing sequences mainly moved the surface layers, with 4.7% and 5.5% (Figure 5).
Per operating step, Option 1 therefore mixed the largest volume. Over a full cycle, however, the existing system activates its six gas lances in turn and reaches up to 48% ofthe volume at different moments, against 20% for Option 1 and 22% for Option 2. Because the sludge is viscous, the motion around one lance is expected to fade once the next lance starts, and the lower part of the digester stays slow throughout the cycle. The velocity results alone did not show which system performs best overall.
Long term solids distribution
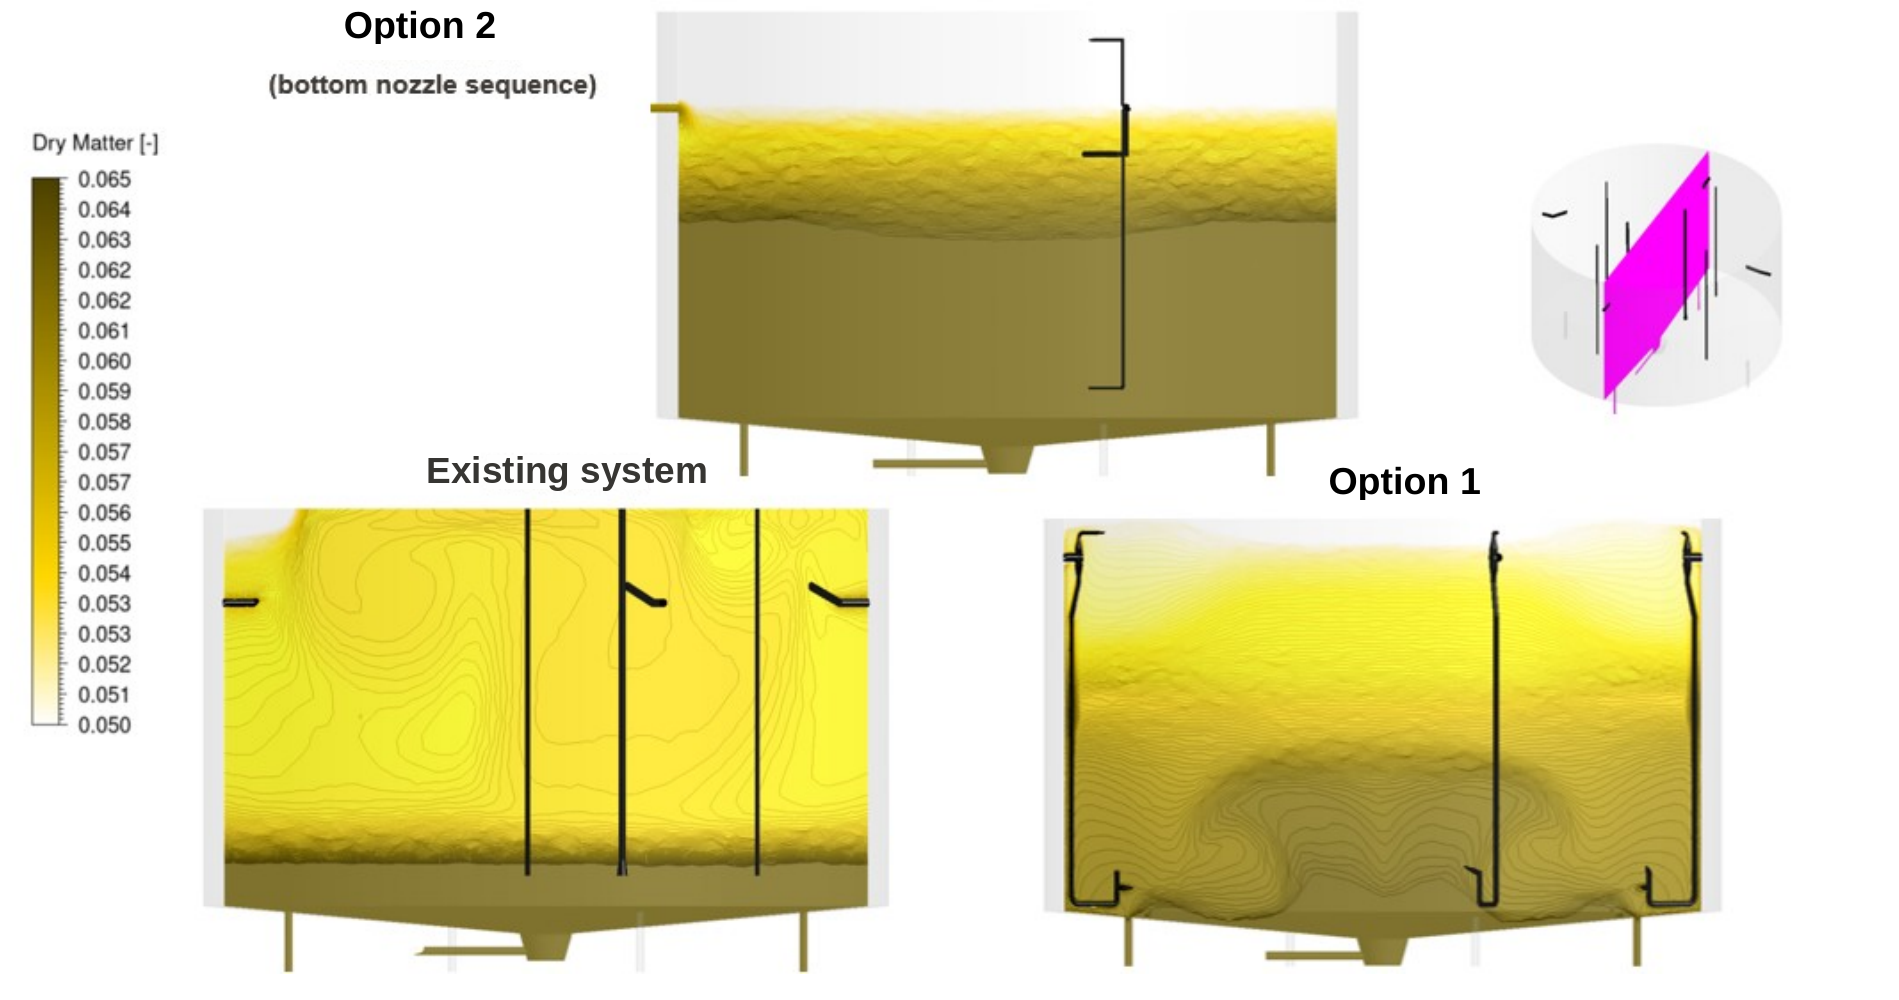
AM-Team then simulated how the solids settle and accumulate in each system. At 6% dry solids the settling velocity is very low, so the results represent the long-term condition of the digester (Figure 6).
With the existing system, the gas lances could not move the sludge at the bottom, and a sludge bed formed with up to 6.5% dry solids, while the rest of the volume stayed fairly uniform. Option 1 kept the sludge in suspension: the nozzles pushed it towards the centre and upward, giving the lowest and most uniform bottom concentrations and the least vertical stratification. Option 2, in its bottom nozzle sequence, did not prevent stratification despite its high bottom velocities: a thick sludge bed formed from mid height downward, with very low concentrations at the top.
The solids model thus separated the three systems where the velocity analysis could not, and pointed to Option 1 as the best performing mixing system.
“The solids modelling made the difference. Two systems looked comparable on velocity, but only one kept the digester homogeneous over the long term and high sludge concentration. This gave us a sound basis to weigh the mixing options against the other factors of a major investment decision.“ - Luca Pedrazzi, Eng., Head of Wastewater and Environmental Protection, BrianzAcque
Structural investigations and the decision for a new digester
During the technical and economic feasibility, BrianzAcque investigated the existing digester with structural surveys. The individual structural elements showed good mechanical properties, but the compression state of the structure was critical.
BrianzAcque then compared the initial investment cost (CAPEX) of refurbishing the existing digester with that of a new build. With equal operating costs (OPEX) and equal payback time, demolishing the existing tank and building a new digester proved the more convenient route. It also allowed BrianzAcque to consider more modern technologies and digestion processes, with considerably higher biogas production than today.
The CFD study gave BrianzAcque a quantified view of what each mixing option could deliver, so mixing performance could be weighted together with the structural condition.
Conclusion and impact
Over the long term, the existing system was predicted to build a sludge bed of up to 6.5% dry solids and Option 2 to stratify from mid height, while Option 1 kept the bottom solids lowest and most uniform. Therefore Option 1 showed the best overall performance.
Structural investigations later showed that a new digester was the more convenient investment. BrianzAcque took that decision with a clear, physics-based benchmark of mixing performance, and with a deeper understanding of the hydrodynamics and solids behaviour of its digesters that will be carried into the design of the new one.
Acknowledgements
AM-Team would like to thank BrianzAcque, and in particular Sara Lorenzini and Luca Pedrazzifor their collaboration during the project and their help in co-authoring this case.
Contact us
Suggested Projects


Subscribe to our newsletter



